01
Find the setup.
Look for a large signal circle and its confirmed divergence diamond for a core setup.
 Get the indicator
≈ BUILT FOR TRADINGVIEW
A clearer view of momentum.
Waveform brings swing signals and divergence together, right on your charts.
One payment. Lifetime access. Includes applicable tax.
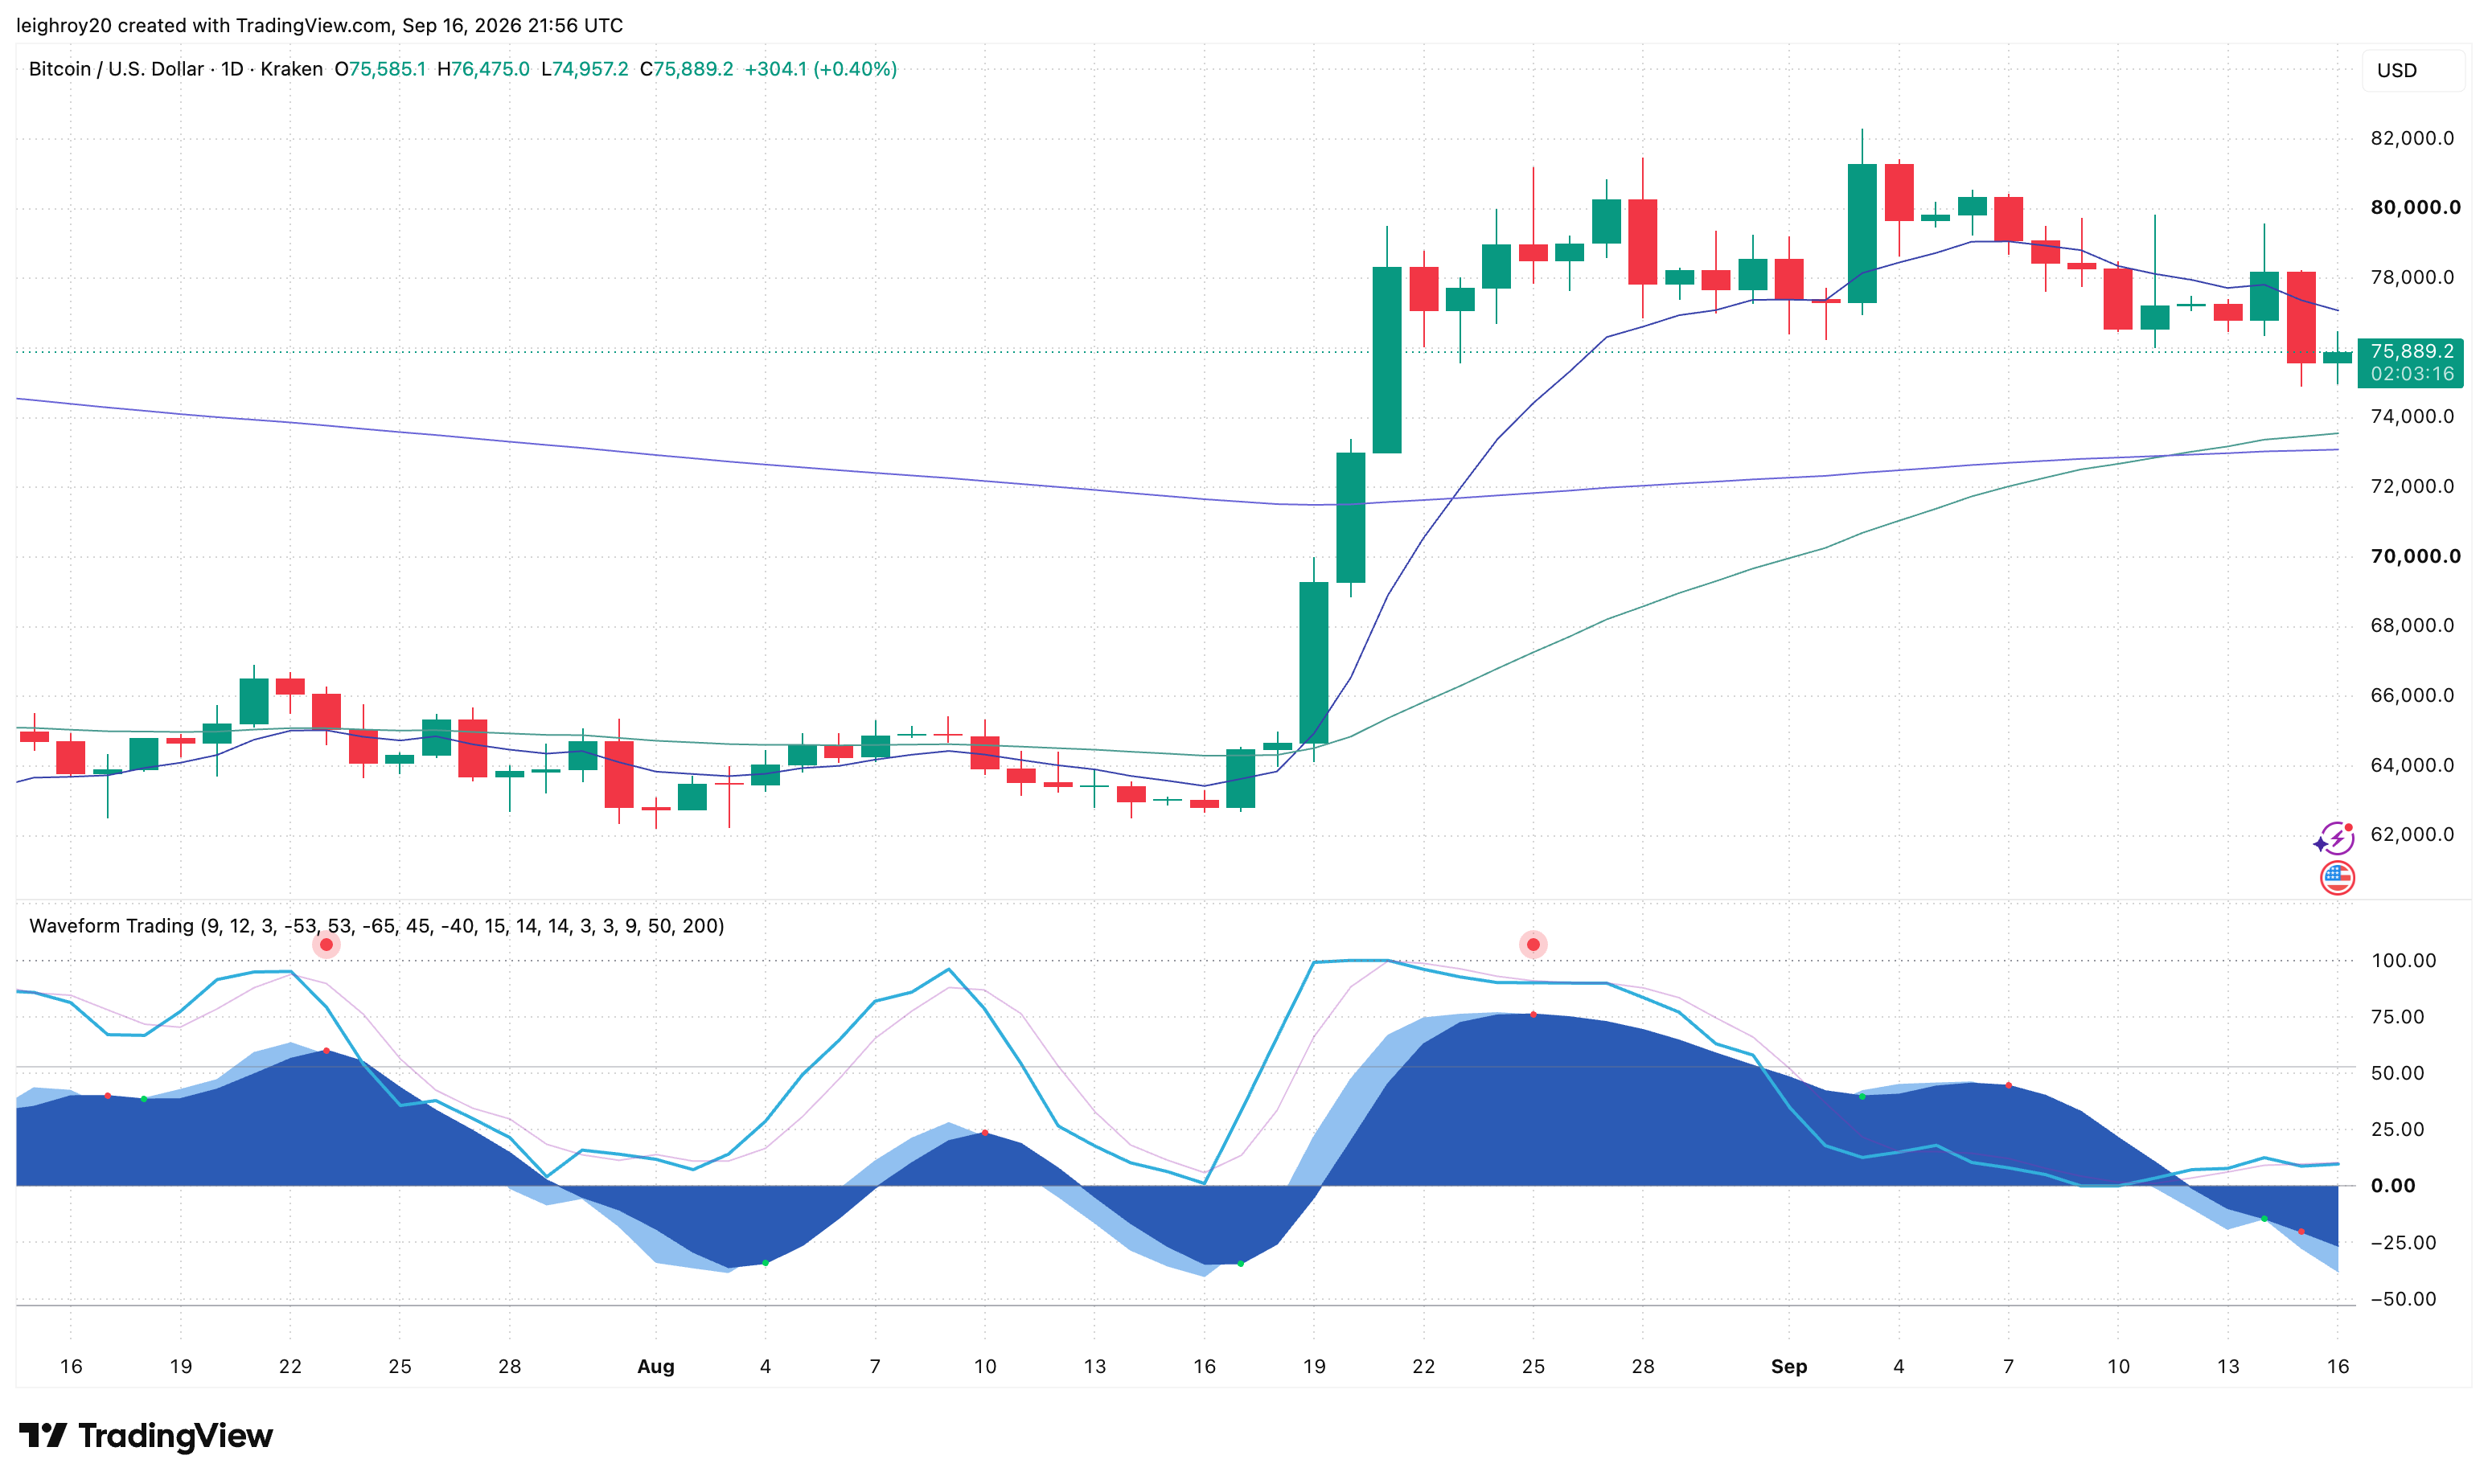
THE WAVEFORM INDICATOR
Bring Waveform to the charts you already use, with the guidance to make it part of your own process.
LIFETIME INDICATOR ACCESS
US$99USD · paid onceOne payment. Lifetime indicator access.
Works with a free TradingView account. Setup help included.
Buy WAVEFORM Automatic activation after confirmed payment. TradingView plans are separate.Read purchase termsREAD THE MOVE
Keep price at the centre of your decisions. Waveform adds a visual layer for reading momentum and planning what comes next.
Look for a large signal circle and its confirmed divergence diamond for a core setup.
Wait for confirmation, check price structure, and plan your stop and position size.
Take planned partial exits at opposing dots; close or tighten the remainder at opposing confirmed divergence.
RECENT SETUPS
Real charts. The signals we’re looking at, and the moves that followed.
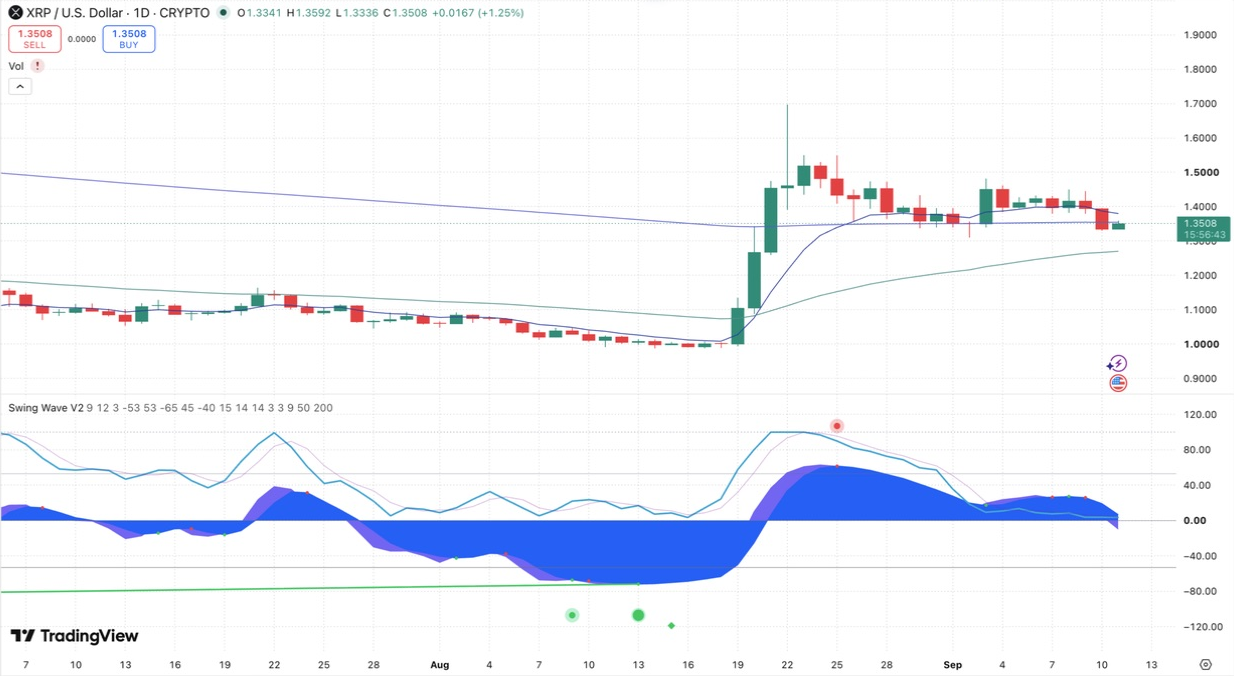
15–25 August 2026
Bullish divergence confirmed before the rally. The next large red signal gives us a point to review the move.
$1.0017 → $1.4339 · confirmation close to signal close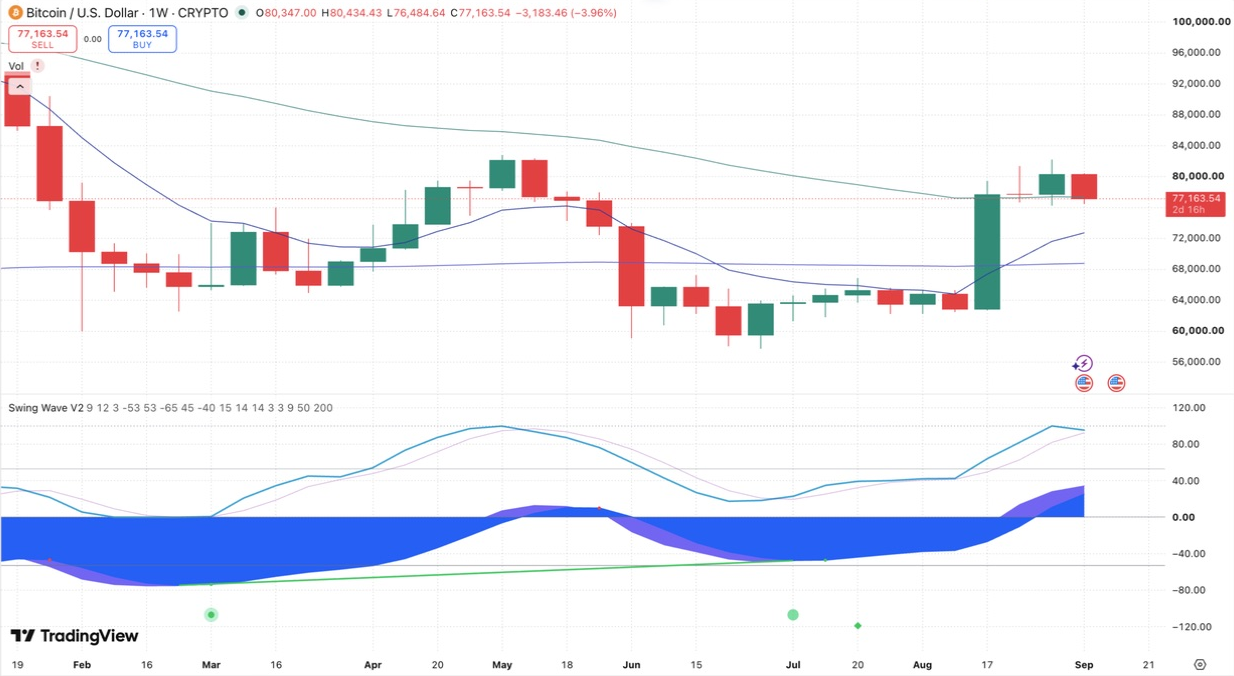
20 July–11 September 2026
A weekly bullish confirmation, followed by a push higher. An archived snapshot of a setup that was still open on 11 September 2026.
$65,338 → $77,164 · confirmation close to 11 Sep snapshot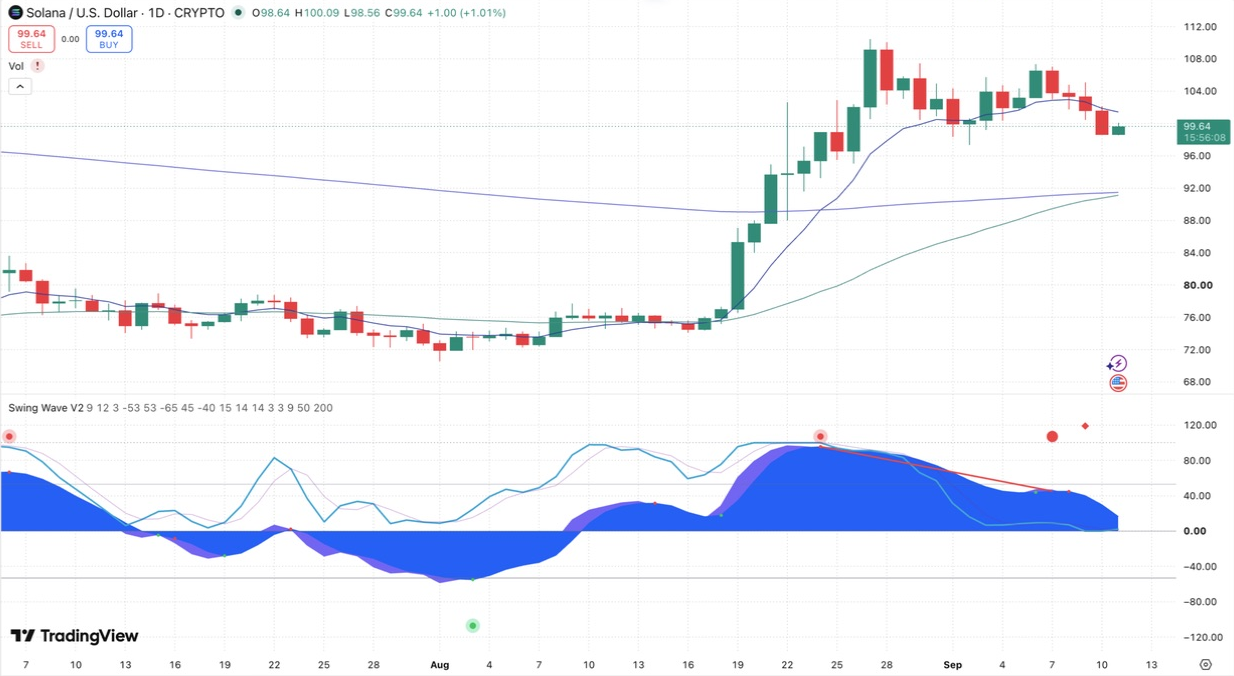
3–24 August 2026
The large green signal preceded this rally. This example uses the large dots, without a paired bullish divergence.
$73.48 → $98.96 · green signal close to red signal closeSelected historical examples, captured 11 September 2026. Percentages measure price changes between the marked points, not realised strategy returns. Bitcoin’s example was still open at that snapshot; this is not a current market update.
BITCOIN / DAILY · SEPTEMBER 2025–SEPTEMBER 2026
Move in signal direction
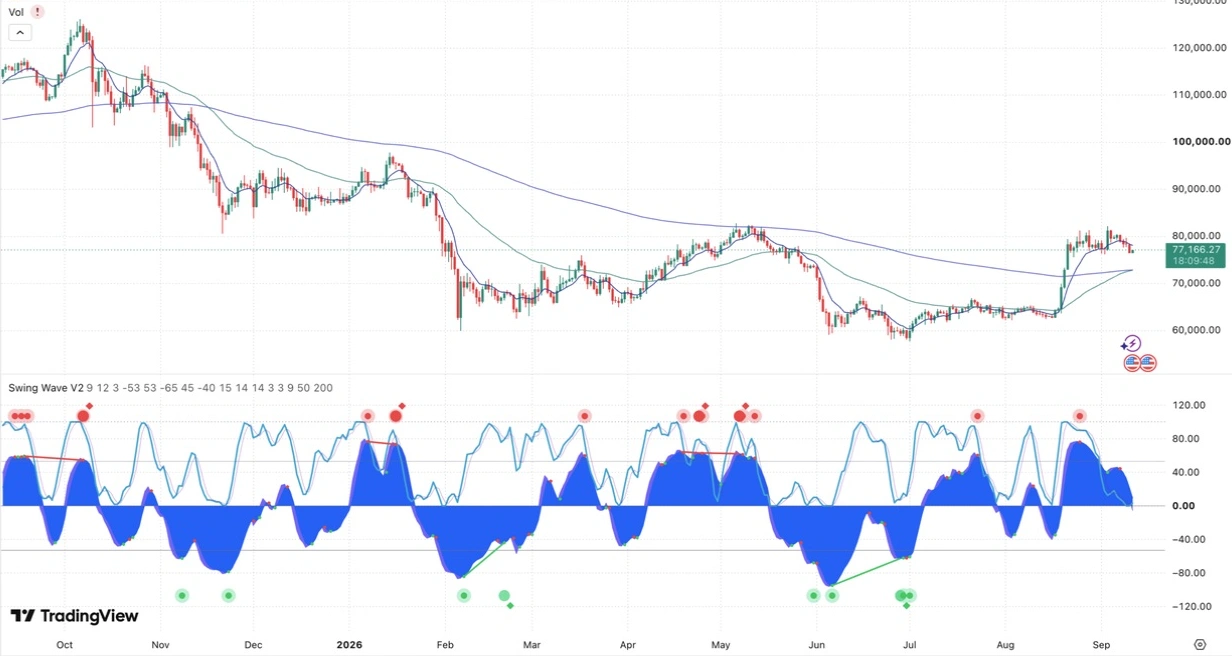
The moves behind the walkthrough. Follow the highlighted swings across the year. Select a move to see its dates and measurement points.
5 ILLUSTRATED MOVESSelected historical price moves in the signal’s direction. These percentages are not realised trading returns, a backtest or a total return. Partial exits, stop-outs and costs change trade outcomes. The developing long is measured to the saved snapshot, with no final exit assumed.
THE FULL WALKTHROUGH
Follow the Bitcoin setups from start to finish. Entries, partial exits and moving stops, explained on the chart.
A historical walkthrough of how we’d use the indicator. Trade entries, partial exits and stops are illustrative. Read the timing and return notes.
THE WAVEFORM APPROACH
Our aim is patient accumulation through planned trades, rather than chasing quick riches. Give a setup room to develop, manage the downside and let the trade earn its next step.
Daily and weekly charts are where we place our highest conviction. Start with the bigger picture to assess momentum, identify swing setups and build your trade plan.
Plan around a 30–90-day swing-trade horizon. Some trades finish sooner; stronger runners can last longer. Let the setup and your exit rules guide how long you stay in the trade.
Waveform can aid shorter-term and day-trading decisions, but we place less confidence in those signals alone. Pair them with price structure, support and resistance, or your existing strategy to plan setups, entries and exits.
CHOOSE YOUR EXPOSURE
Our starting point is unleveraged spot. For traders who understand and choose leverage, our preferred approach is 3× rather than 5× or 10×. Even 3× carries substantial risk: leverage changes exposure, not signal quality.
Protect the trade before pursuing the upside. Set stops around the setup’s invalidation and market volatility, then size the position to the loss you can accept. Do not simply squeeze a stop closer to justify more leverage. Stop orders can slip and do not guarantee protection from liquidation. Funding or borrowing costs can also accumulate over a long hold.
Read more about leverage riskTHE CORE TRADING FRAMEWORK
We aim to capture opportunities in rising and falling markets throughout the year. Follow a clear process for confirming entries, managing risk and taking profits as the move develops.
FOLLOW THE MARKERS
XRP · DAILY · AUGUST 2026The green circle marks the bullish setup. Wait for the later confirmation diamond before assessing the long entry. The entry marker points to the confirmation candle, not the earlier pivot.
Historical charts with illustrative entry, take-profit and stop annotations. These show how to apply the framework; they do not represent actual trade executions. On mobile, swipe the chart to inspect the labels.
See the signals in context. Explore the past year of Bitcoin price action alongside Waveform’s signals. Follow the highlighted moves in both directions and see how the framework can guide entries, partial profits and exit decisions.
Explore the Bitcoin year chartBEFORE YOU START
The offer, the setup and what to expect from Waveform.
Explore the customer guideGETTING STARTED
Getting set up is simple: access is connected to your TradingView account, so the indicator lives where you trade.
Provide your TradingView username when you order. This is the account we’ll grant access to.
Once access is confirmed, open your chart and go to Indicators → Invite-only scripts. Select Waveform.
Choose your market and timeframe, review the quick-start guide, and save your chart layout.
BRING WAVEFORM TO YOUR CHARTS
US$99. One payment. Lifetime indicator access.